An initiative that aims to empower women and the LGBTQIA+ community (often most vulnerable in the inner city and Southern African communities) to express their relationship with the city and their environment.
Interested to collaborate or host SUPERPOWER! in your city? Visit superpower.lingql.com to find out more.
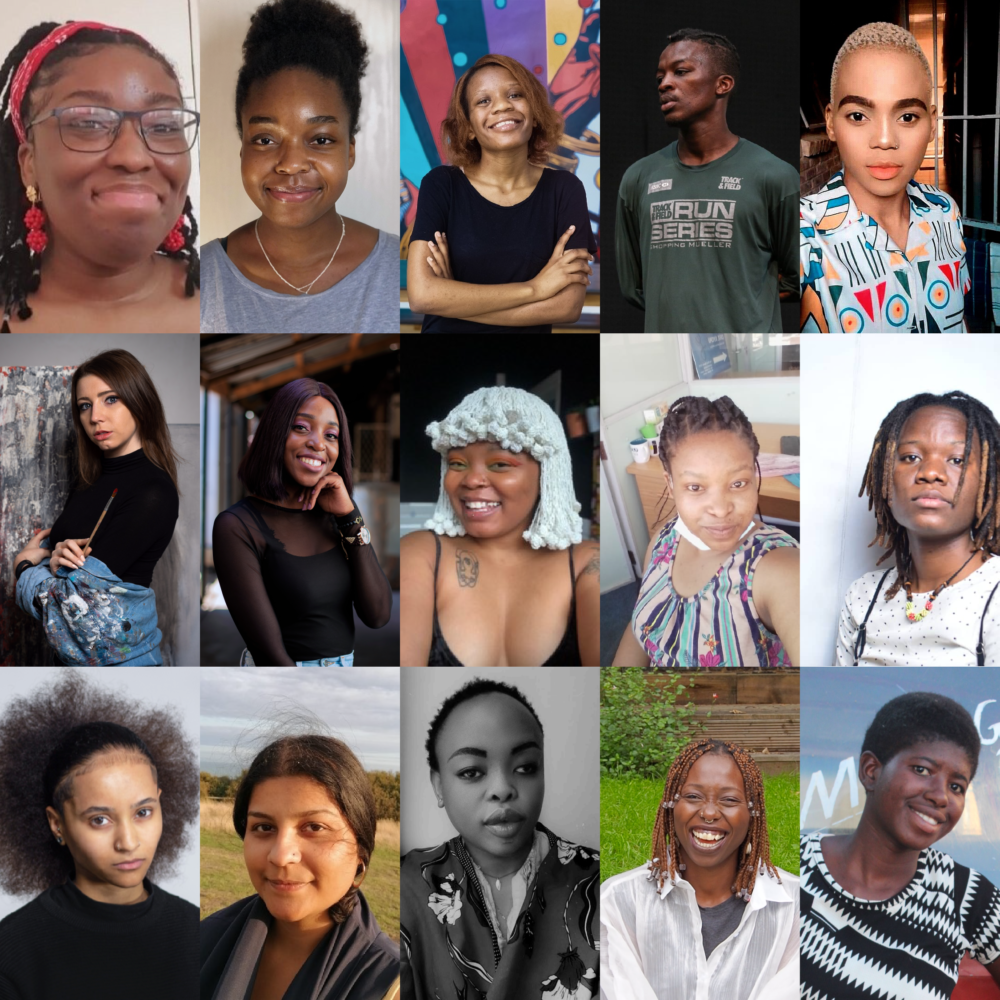
Over a period of 3 weeks, 15 young creatives and artists from Johannesburg (SA), Bulawayo(ZW), and London(UK) gathered online to explore issues surrounding gender safety in the urban centers of London, Bulawayo, and Johannesburg.
Developed during the COVID pandemic, each participant worked remotely in their respective city and used a custom SUPERPOWER! gesture sensing data collection digital platform to explore and collect data surrounding their own subjective perception and their communities’ experiences of gender safety in their own city. Participants shared their findings with each other and individually developed a digital artwork that captures their data findings and expresses their opinions about gender safety issues in their own city. Their artworks were exhibited in a digital gallery as part of the Fak’ugesi African Digital Innovation Festival 2021.
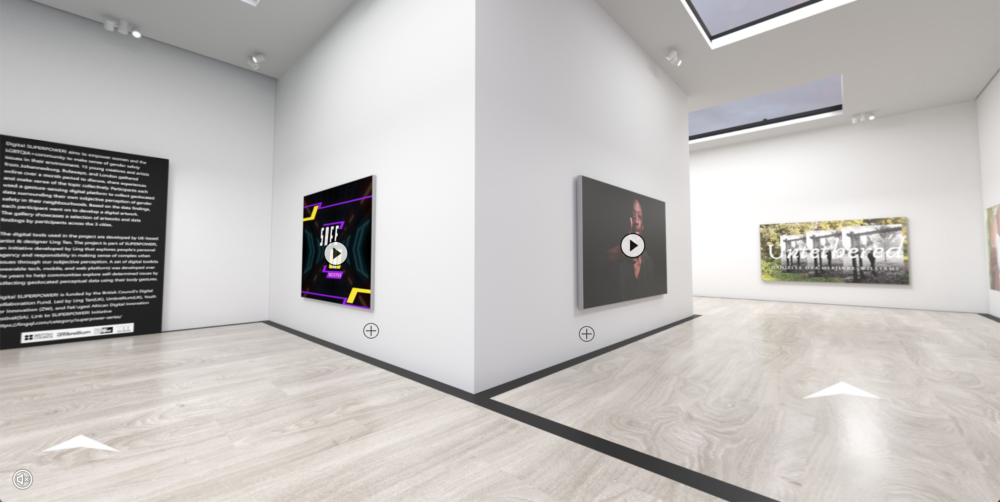
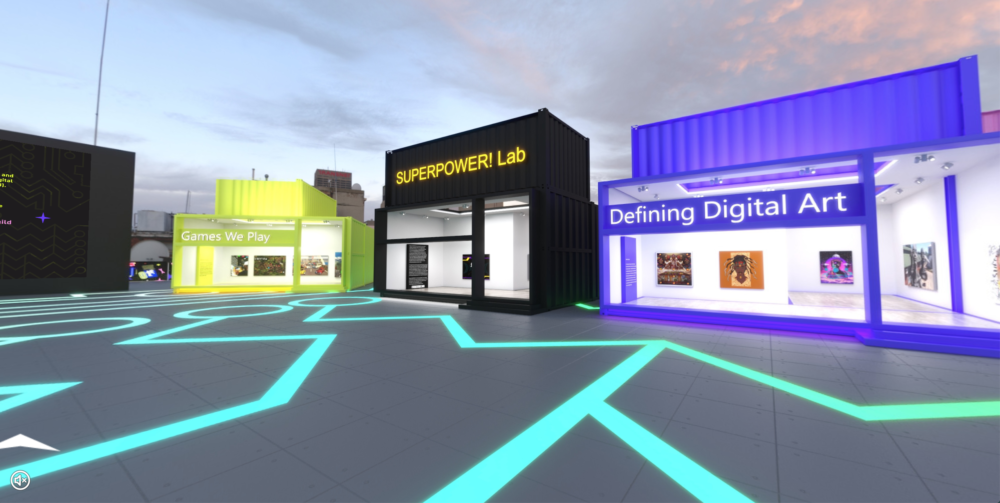
Visit the project’s website to see all the data experiments and artworks.
Below is a selection of data findings and artworks by various participants across the 3 cities.
Dlozi Lloyd Mthethwa (SA)
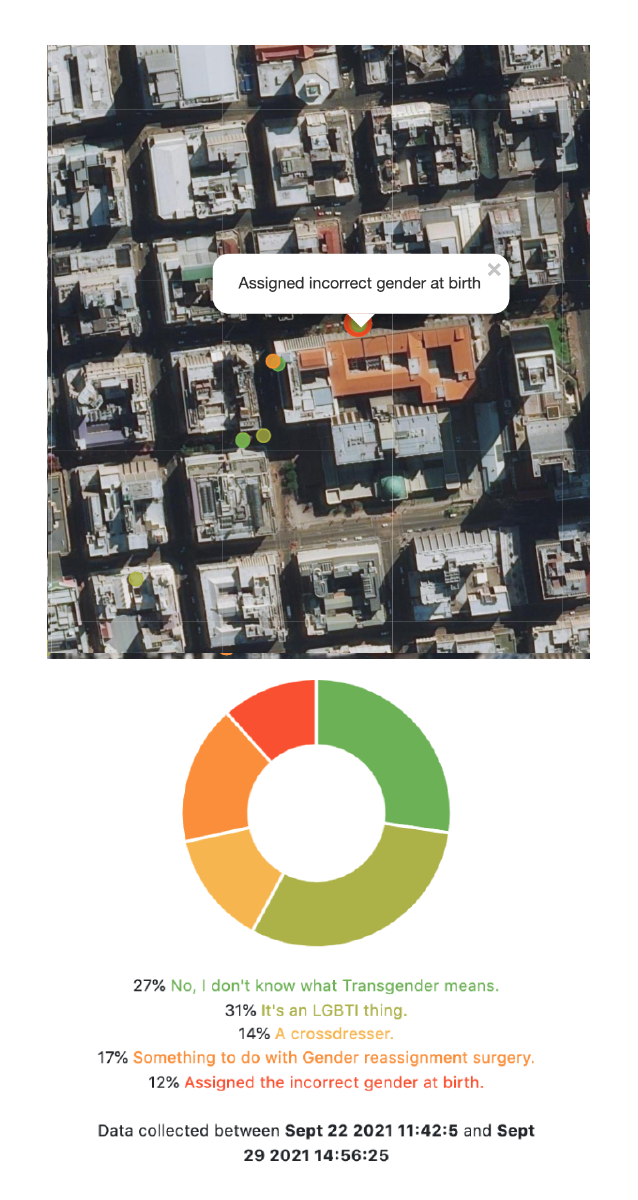
“Do people in high-income places have less GBV and high levels of sex education?Is there a correlation between the levels of sex education in an area and the levels of GBV that takes place? I decided I would go to three different areas and segregate them by levels of income or rather property value. I did the affluent Johannesburg North; the middle-income areas like Melville and Braamfontein; final Newlands and CBD was representing low income. My research was conducted during the week to increase the chances of finding natives in the area. I interviewed more than 130 people in the City of Johannesburg municipality area.”
Dlozi’s artwork is a video featuring a person accessing a site for gender safety insurance: a subscription service that offers one less exposure to GBV by endowing the member with privileges that would make them less vulnerable. They review the options for the different packages one could take out and lastly, they do a risk assessment calculator to help them find their best cover. The questions asked by the website are supported by screenshots of GBV stats. Click here to learn more about Dlozi’s data experiment and artwork.
Rumbo Mercy (SA)
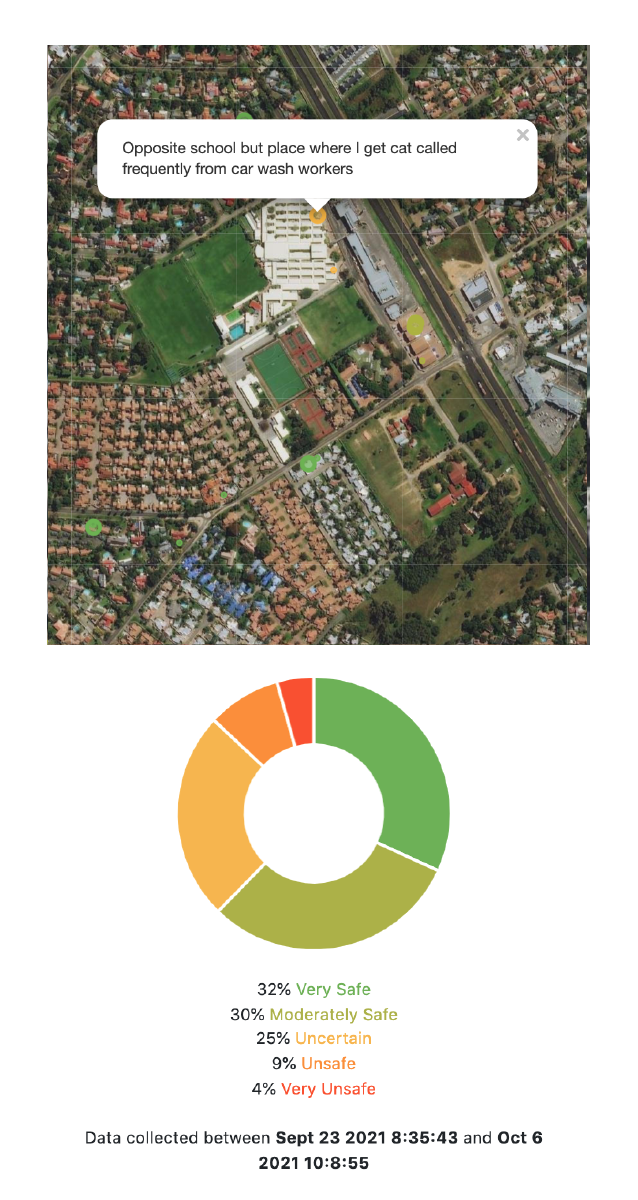
“My experiment was analysing how different environments affected my personal feelings of safety in Johannesburg. I collected data around my emotional response to my everyday surroundings: One in my residential neighbourhood and one in town by my school. I set the gestures based on the safety of each area, ensuring my phone isn’t out too long in less safe places. Because I was mapping the data whilst walking, I couldn’t take detailed notes (especially in unsafe areas), but I also looked at how I physically responded (shoulders raised, alertness, etc.) In the workshops, I saw the difference in gender experiences across the countries and realised the importance of having varied data sets because our experiences were similar but unique.”
Rumbo’s artwork is a fictional universe in which Life is present as a game with the objective to allow women and the LGBTQ+ community to live safely in society. The ‘game over’ slide, shows that we have failed to keep these groups safe. It presents a second attempt at winning and hints on how to win the game. However, the work cannot restart the game and it becomes a stark reminder that one cannot ‘start over’ to solve this issue. Although a complete reset is needed, it is impossible. Click here to learn more about Rumbo’s data experiment and artwork.
Danielle Osajivbe-Williams (UK)
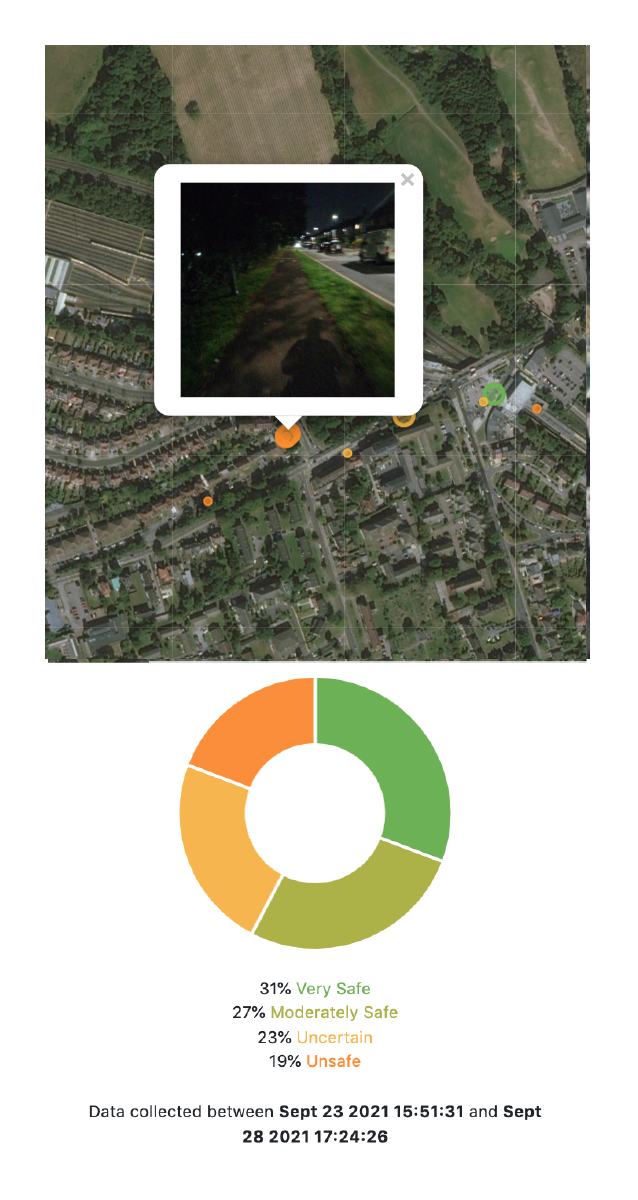
“My topic focused on my experience of safety in areas I frequent, with particular attention to streets and parks. I also explored their feelings in the context of their local and personal histories as they corresponded to gender violence. I traced this based on my emotional and physical sensation and the thoughts that arose.”
Danielle’s video artwork was inspired by her research conducted around the streets and local parks of South East London in Southwark, Lewisham and Greenwich boroughs. She desired to relay the emotive qualities within the process of digital collection, by including the gestures, notes and photos taken. She pay homage to Sabina Nessa who was a recent victim of GBV in Cator Park, Kidbrooke, which she visited and a neighbouring park which has a known history of sexual assault by knife point in daylight by a teen. Click here to learn more about Danielle’s data experiment and artwork.
Ishwari (UK)
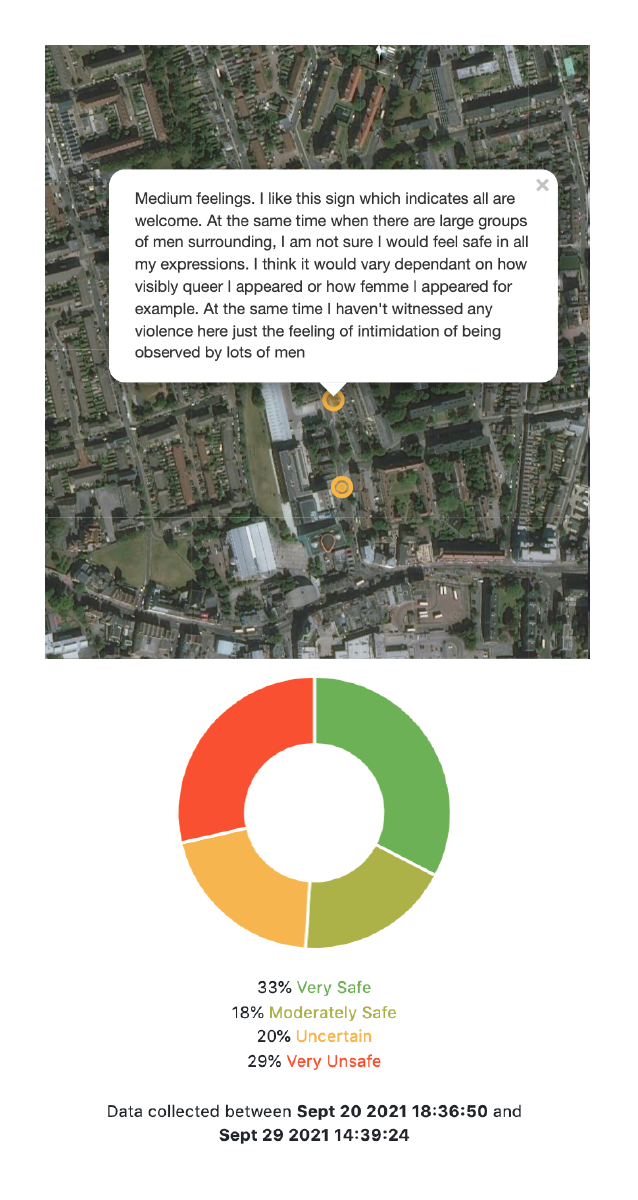
“How does my body feel in different spaces in London, in terms of safety? To collect data, I used the app on the routes that I took everyday, to work or to other places that I went to. I had initially decided to record images of the place and write down how my body feels in certain spaces. For example: was I breathing quickly, did my stomach feel settled or queasy, were my hands sweaty, were my shoulders hunched and so on. I thought of using these bodily responses to map out how safe/unsafe or comfortable/uncomfortable I felt in different public spaces in the city, at different times of the day. I was not interviewing other people. But was asking myself different questions like – how safe/comfortable I feel, how is it different to how I felt in other spaces, at other times?”
Ishwari’s artwork is a series of voice notes from the participants, answering the question: ‘One thing that needs to change to make your city safer for women and LGBTQIA+ communities in your city. Few sentences about why and how it is relevant to your city.’ I will be editing this into small snippets of audio + a visual of the person saying it and potentially the background of screen recordings from the app (time permitting). Click here to learn more about Ishwari’s data experiment and artwork.
Thandokuhle Sibanda(ZW)
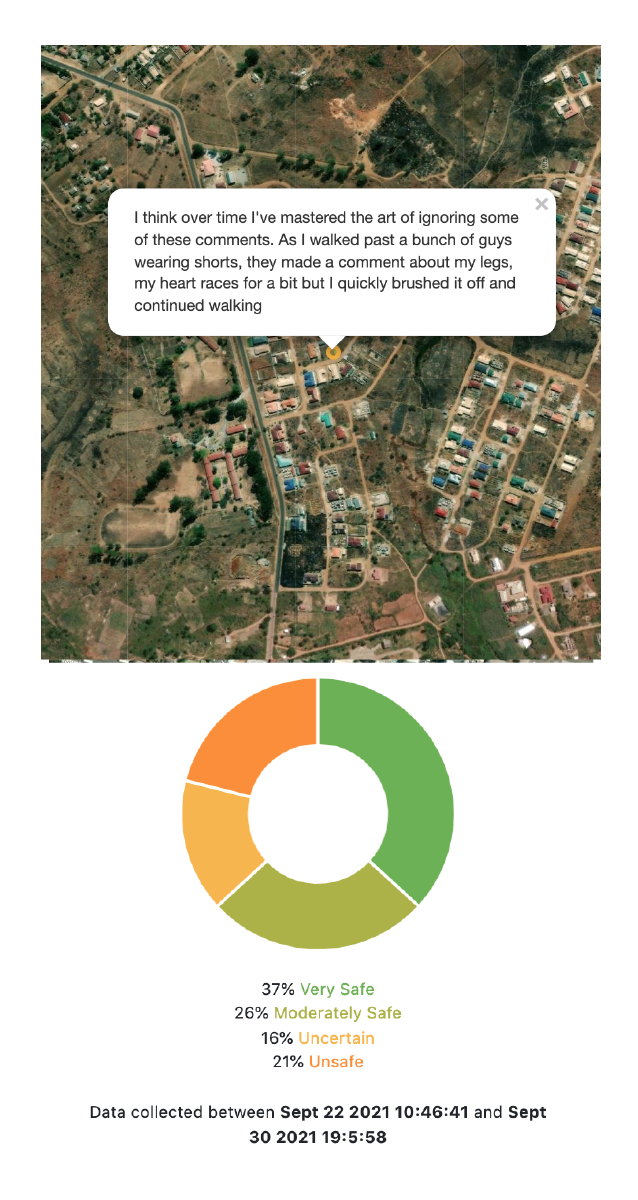
“I was mapping bodily responses to different environments using Value 1 (safe) to value 5 (unsafe). My data ranged mostly between value 1 and value 4. During the experiment I paid particular attention to 5 specific components/ types of environments namely – 1) time of the day/night, 2) who I’m with- alone/with a male or female, 3) population density – High or Low, 4) what I’m wearing- Conservative clothes, clothes that are not so conservative and 5)Nature of the environment- Commercial, Residential, Centre.”
Thandokuhle’s artwork explores the mental state of women in different types of environments. It looks at the struggle every single day brings and how they adjust and adapt so they can stay afloat. The artwork is a combination of visuals and poetry. The story looks at a day in Nonsikelelo’s life. From the time she gets up out of bed, the struggle of leaving the house, surviving the streets and when she eventually goes back to her safe place (home). Click here to learn more about Thandokuhle’s data experiment and artwork.
Digital SUPERPOWER! is funded by British Council through the Digital Collaboration Restart Grant led by Ling Tan(UK), in partnership with Umbrellium(UK), Youth For Innovation (ZW) and Fak’ugesi African Digital Innovation Festival(SA).